Multi Series Chart
Overview
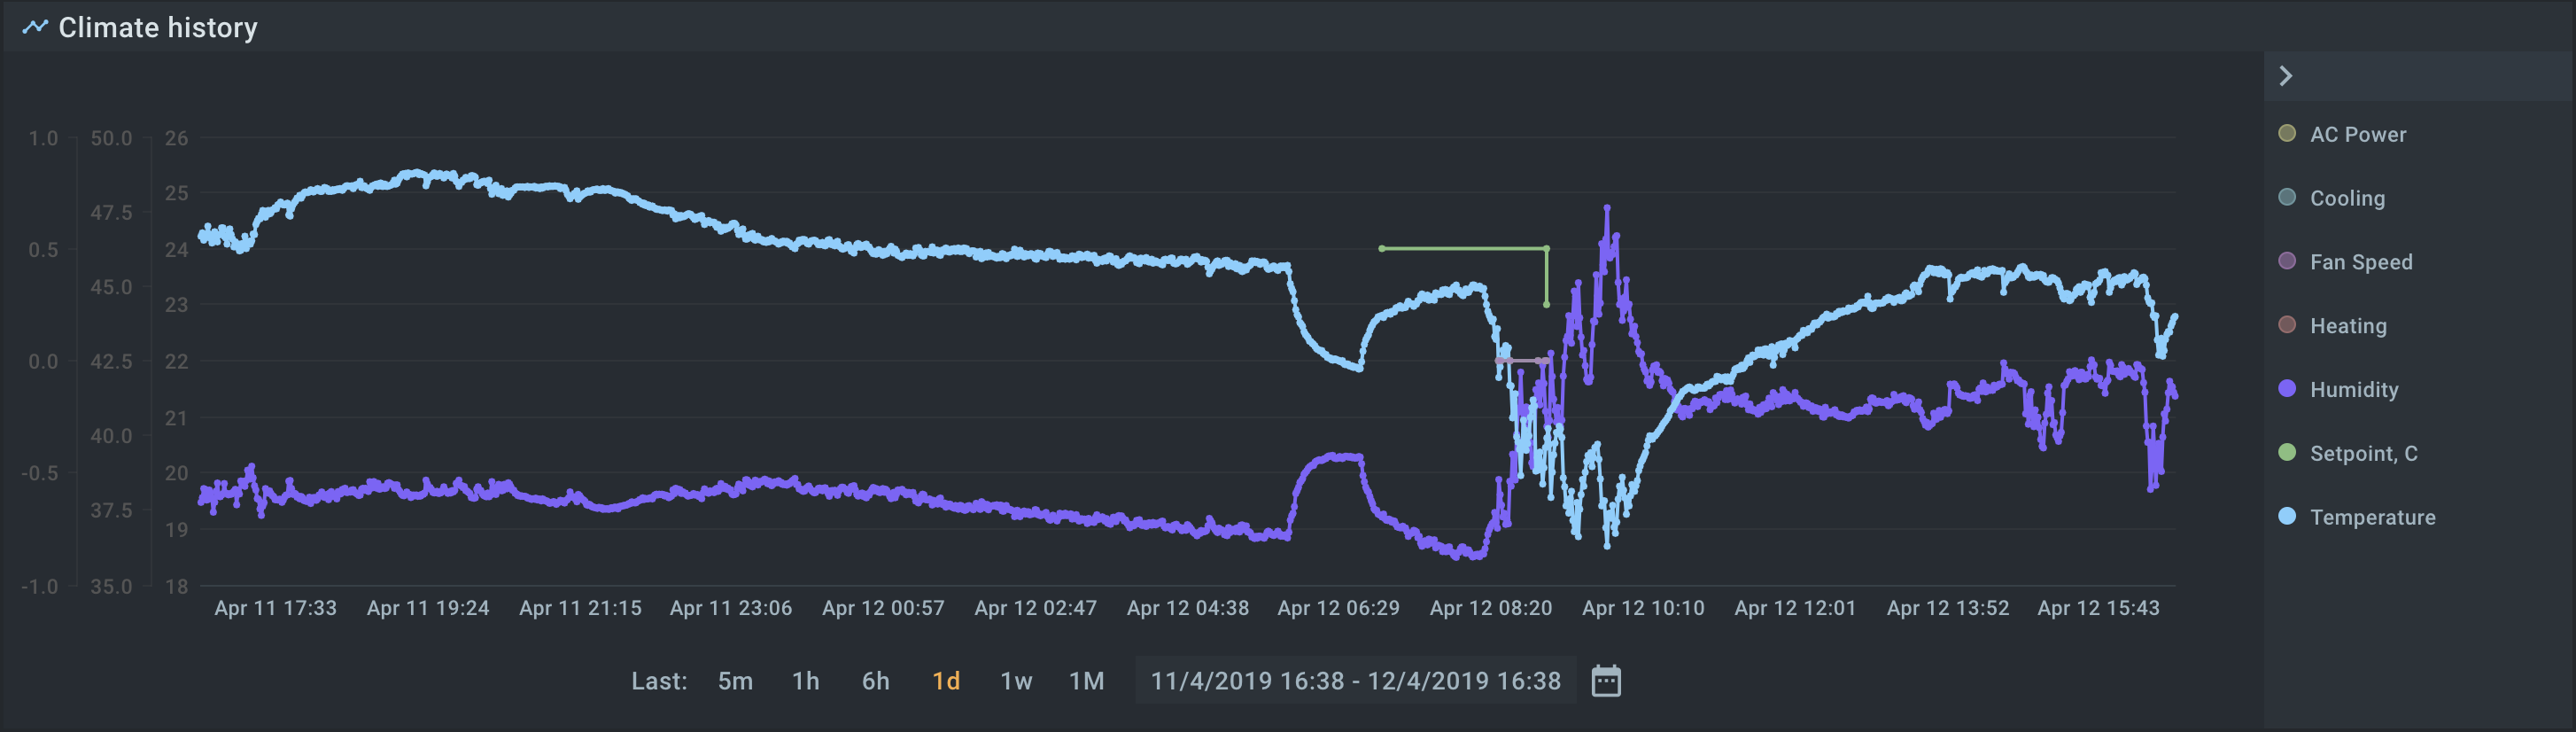
Multi Series Chart widget displays a chart graph that shows time series data for one or more endpoints.
config:
  type: multiSeriesChart
Widget configuration
Multi Series Chart widget has the following configuration:
config:
  type: multiSeriesChart  # Always "multiSeriesChart". REQUIRED.
  header:
    title:                # Widget title text.
    displayTitle: true    # Indicates whether to display widget title text.
    iconPath:             # Path to icon.
  serviceIntegration:
    service:              # EPTS service instance. REQUIRED.
    appName:              # Application name to filter configurable time series
    endpoints:            # Specifies endpoints single id, multiple ids or to show data for.
    showLast:             # Specifies the default time frame, in seconds, when widget is loaded. By default, 1 hour.
    downsampleThreshold:  # Threshold value for downsampling the data before rendering the chart (this may improve on-page performance).
                          # '0' turns the downsampling off. See demo with other possible values here - http://flot.base.is/ . OPTIONAL.
    timeSeries:           # Array of time series.
      - name:             # Time series name to get data from. REQUIRED.
        valuePath:        # Path in EPTS response where timeseries value is placed. OPTIONAL. Default: 'value'.
        label:            # Time series label to be output in the chart legend. OPTIONAL.
        unit:             # Measuring the data unit to display in the tooltip.
        yaxis:            # Matching the corresponding `Y` axis for the current timeseries. REQUIRED if axes.yaxes is  defined above.
        styling:
          lineColor:        # Color of the line.
          seriesStyle:      # If set to step, step style will be output, else - line.
  isLegendOpen:           # Defined whether the legend should be open or closed by default. By default - true.
  grid:                   # Defined whether the chart grid is to be shown. OPTIONAL.
    show:                 # True or false. By default `true`.
  axes:                   # Configurations for `X` and `Y` axes. OPTIONAL.
    yaxes:                # A list of `Y` axes. OPTIONAL.
      - position:         # Position of the axis: left, right. REQUIRED.
        suffix:           # Suffix to append to the axis tick.
        axisLabel:        # Label for the current `Y` axis.
    xaxis:                # Configuration for `X` axis. OPTIONAL.
      axisLabel:          # Label for the `X` axis.
Properties scope
There are different ways to define the endpoints property for the Multi Series Chart widget:
- When you need the ID of an endpoint dashboard
- When you specify a single endpoint
- When you specify an array of endpoints
Here’s an example of how you can define the endpoints property:
Display time series data of an endpoint of the current dashboard:
config:
  endpoints: ${dashboard.id}
Display time series data of specific endpoints:
config:
  endpoints:
    - enpodint_id_1
    - endpoint_id_2
Timestamp controls
Multi Series Chart widget provides simple timestamp controls that allow users to change the timeframe for the chart.
If user chooses one of the available period values, it will override the showLast property value defined in the configuration.
If user chooses new date from time picker, the widget will show historical data.
Example configuration
Below is an example of minimal valid configuration for the Multi Series Chart widget:
- config:
    header:
      title: Temperature in office room
      displayTitle: true
    type: multiSeriesChart
    serviceIntegration:
      service:              # EPTS service instance. REQUIRED.
      timeSeries:           # Array of time series.
        - name:             # Time series name to get data from. REQUIRED.
          label:            # Time series label to be output in the chart legend. OPTIONAL.
    service: epts
    dataSource:
      timeSeries:
      - timelineLabel: Time
        displayName: Temperature
        name: tsTemperature
        unit: "°C"
Interfaces
Multi Series Chart supports a number of service interfaces to perform its functional role. The key supported interfaces are summarized in the following diagram.

For service communication, WD widgets mainly use REST APIs.