Data collection
In this tutorial, we will look at how to collect telemetry data from a simulated device to the Kaa platform. We will learn how to transform collected data into well-structured time series and visualize it on the Kaa web interface.
Overview
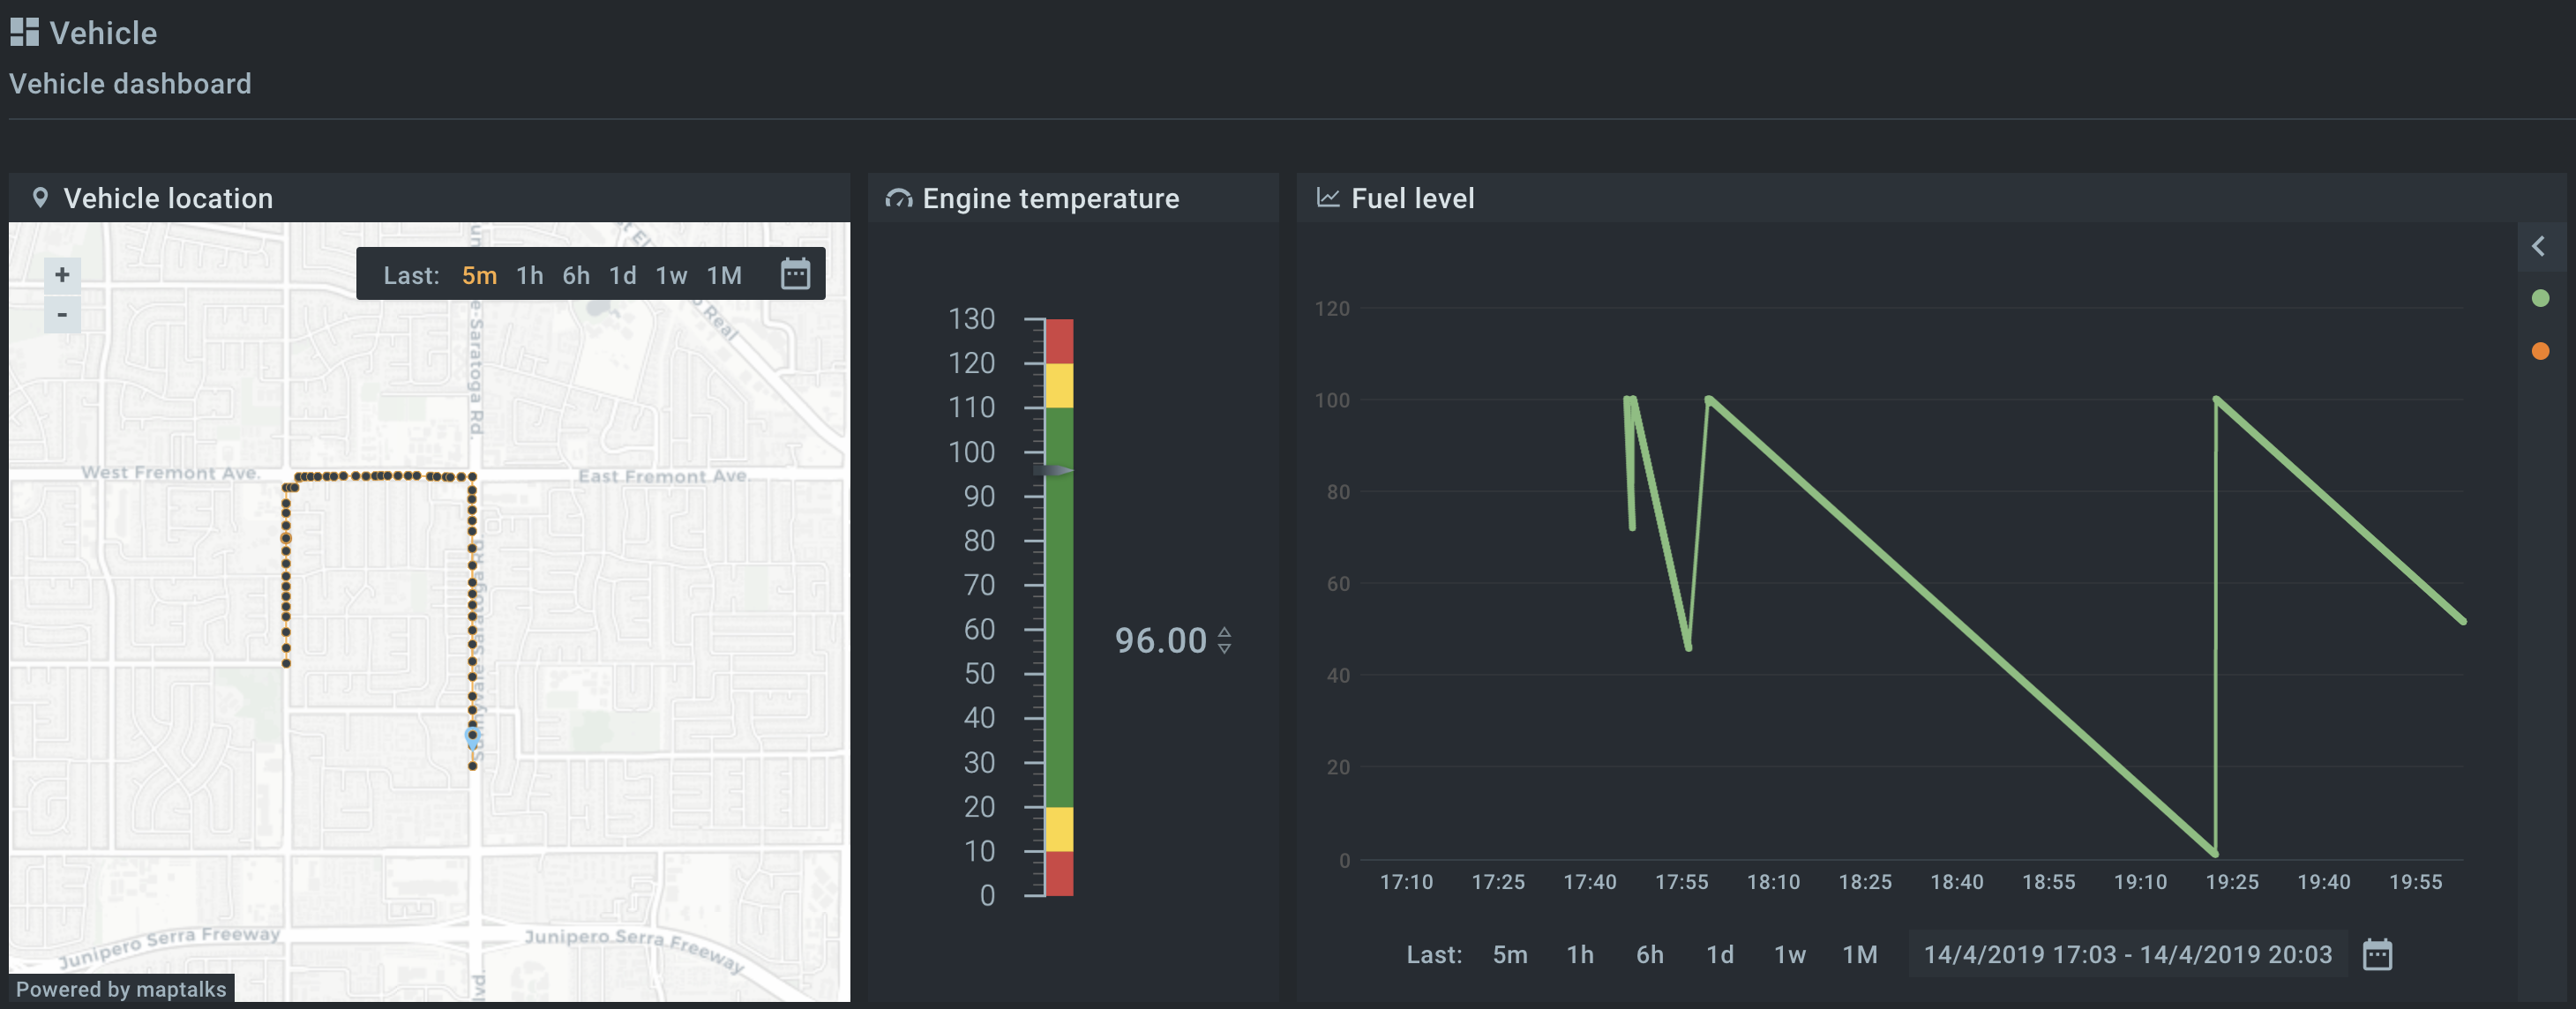
We will simulate the fleet management scenario. Our endpoint will act as a device, which is integrated into a vehicle, and reports its location (latitude and longitude), engine temperature and fuel level to the Kaa platform.
Also, we will configure Web Dashboard with the Endpoint Location widget for historical and realtime vehicle location, Gauge widget for the current engine temperature and Multi Series Chart widget for the fuel level.

Prerequisites
- You know the Kaa platform data collection basics.
- You know how to connect a device to the Kaa platform.
- The Kaa platform is up and running with the following microservices included:
- Python 2.7 is installed on your machine.
Playbook
1. Open Kaa Cluster blueprint and configure EPTS service with the temperature, fuel_level and location time series:
kaa:
  applications:
    demo_application:
      versions:
        demo_application_v1:
      time-series:
        auto-extract: true # Extract all properties from data sample
        names:
          temperature:
            values:
              - path: "temperature" # Path to this field in incoming data sample. Required.
                name: "temperature" # Name of time series field that will be used in EPTS response body. If this configuration absent, EPTS will use "value" by default. Note: that one time series must not have several fields with name - "value".
                type: "number"      # Type of extracted field. Could be one of "String" or "Number".  The "Number" represents JSON number data type.
          fuel_level:
            values:
              - path: "fuelLevel"
                type: "number"
          location:
            values:
              - path: "latitude"
                name: "latitude"
                type: "number"
              - path: "longitude"
                name: "longitude"
                type: "number"
        timestamp:
          path: "timestamp"                      # JSON Path of the timestamp field in data sample
          format: "millis-unix-epoch"            # Timestamp format
          fallback-strategy: "server-timestamp"  # Take server timestamp if it is not present in data sample
Here demo_application application has three time series:
temperaturewithtemperaturevalue;fuel_levelwithfuelLevelvalue;locationwithlatitude,longitudevalues.
Also, configuration has data sample structure description for the devices in demo_application_v1 application version.
The timestamp is accessible by $.timestamp JSON path. It is in UNIX format in milliseconds.
When it is not present, EPTS will fall back to the timestamp of when data sample was received by the platform.
Read more about EPTS time series configuration here.
2. Run Python simulator client.py that simulates a vehicle.
python -t myToken -h {host} -p {port} client.py

INFO: Using endpoint token myToken, server at {host}:{port}
DEBUG: Composed data collection topic: kp1/demo_application_v1/dcx/myToken/json/23
INFO: Connecting to KPC instance at {host}:{port}...
INFO: Successfully connected
DEBUG: myToken: Sent next data: [{"latitude": 37.35119, "timestamp": 1555230312868, "temperature": 98, "longitude": -122.03248, "fuelLevel": 100}]
INFO: Message received: topic [kp1/demo_application_v1/dcx/myToken/json/23/status]
body []
...
3. Go to the Web Dashboard and configure an Endpoint Location widget to display current vehicle location.
4. Configure a Gauge widget to display current vehicle engine temperature.
5. Configure a Multi Series Chart widget to display current vehicle fuel level.
Now you can monitor vehicle location, fuel level and engine temperature in real time.
Resources
All tutorial resources are located on GitHub.